Understanding your data is crucial for informed decision-making. Atlassian Analytics is designed to offer just that, combining data from Atlassian products with external sources for comprehensive, strategic insights. Here’s how Atlassian Analytics transforms data into actionable information.
Data Sources
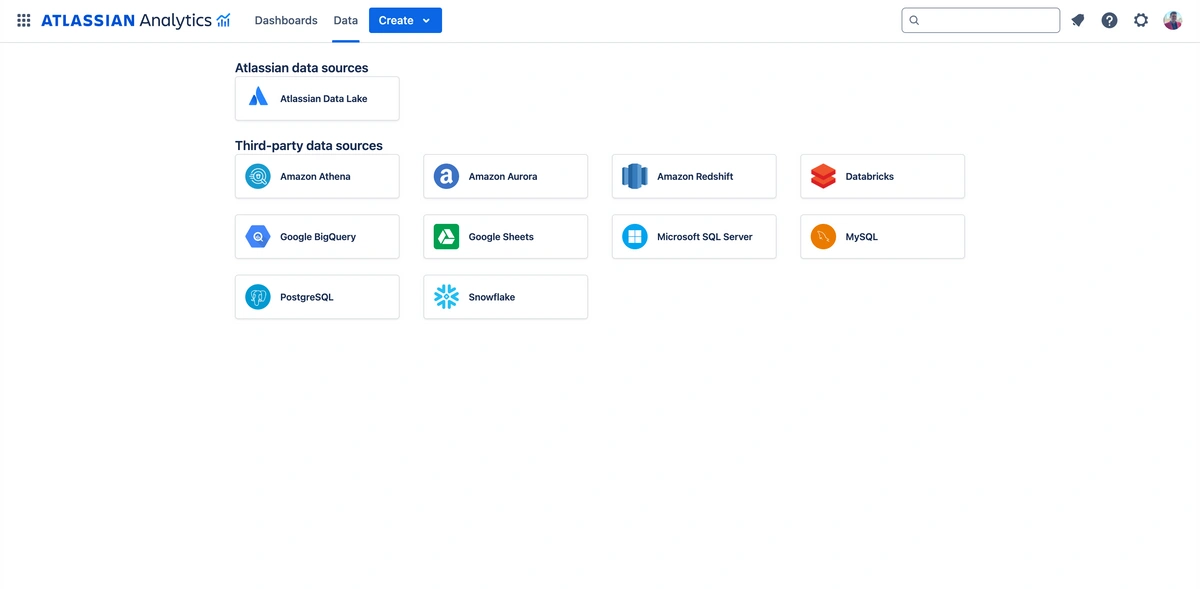
Atlassian Analytics can pull data from multiple sources, including Atlassian's products and external systems. The core source is the Atlassian Data Lake, which consolidates data from Jira Software, Jira Service Management, Confluence, and other Atlassian tools into one queryable system. This provides a unified view of cross-product and cross-instance data, pre-modeled and enriched to make analysis straightforward and efficient.
Users can also blend this internal data with external sources for more comprehensive insights. Atlassian Analytics allows integration with other SaaS products, such as databases or third-party business intelligence (BI) tools like Snowflake or Databricks. This functionality enables users to compare Atlassian data (e.g., development or incident metrics) with business-critical data such as revenue or customer satisfaction, helping to create more strategic insights.
Atlassian Data Lake
Data Lake is a centralized repository designed to store and aggregate data from Atlassian products like Jira Software, Jira Service Management, Confluence, and more. It allows users to perform in-depth analysis by providing pre-modeled and enriched fields, making it easier to query and generate insights without requiring extensive data modeling expertise. This data lake supports cross-product and cross-instance analysis, simplifying gaining a unified view of organizational data.

Granular Atlassian data selection
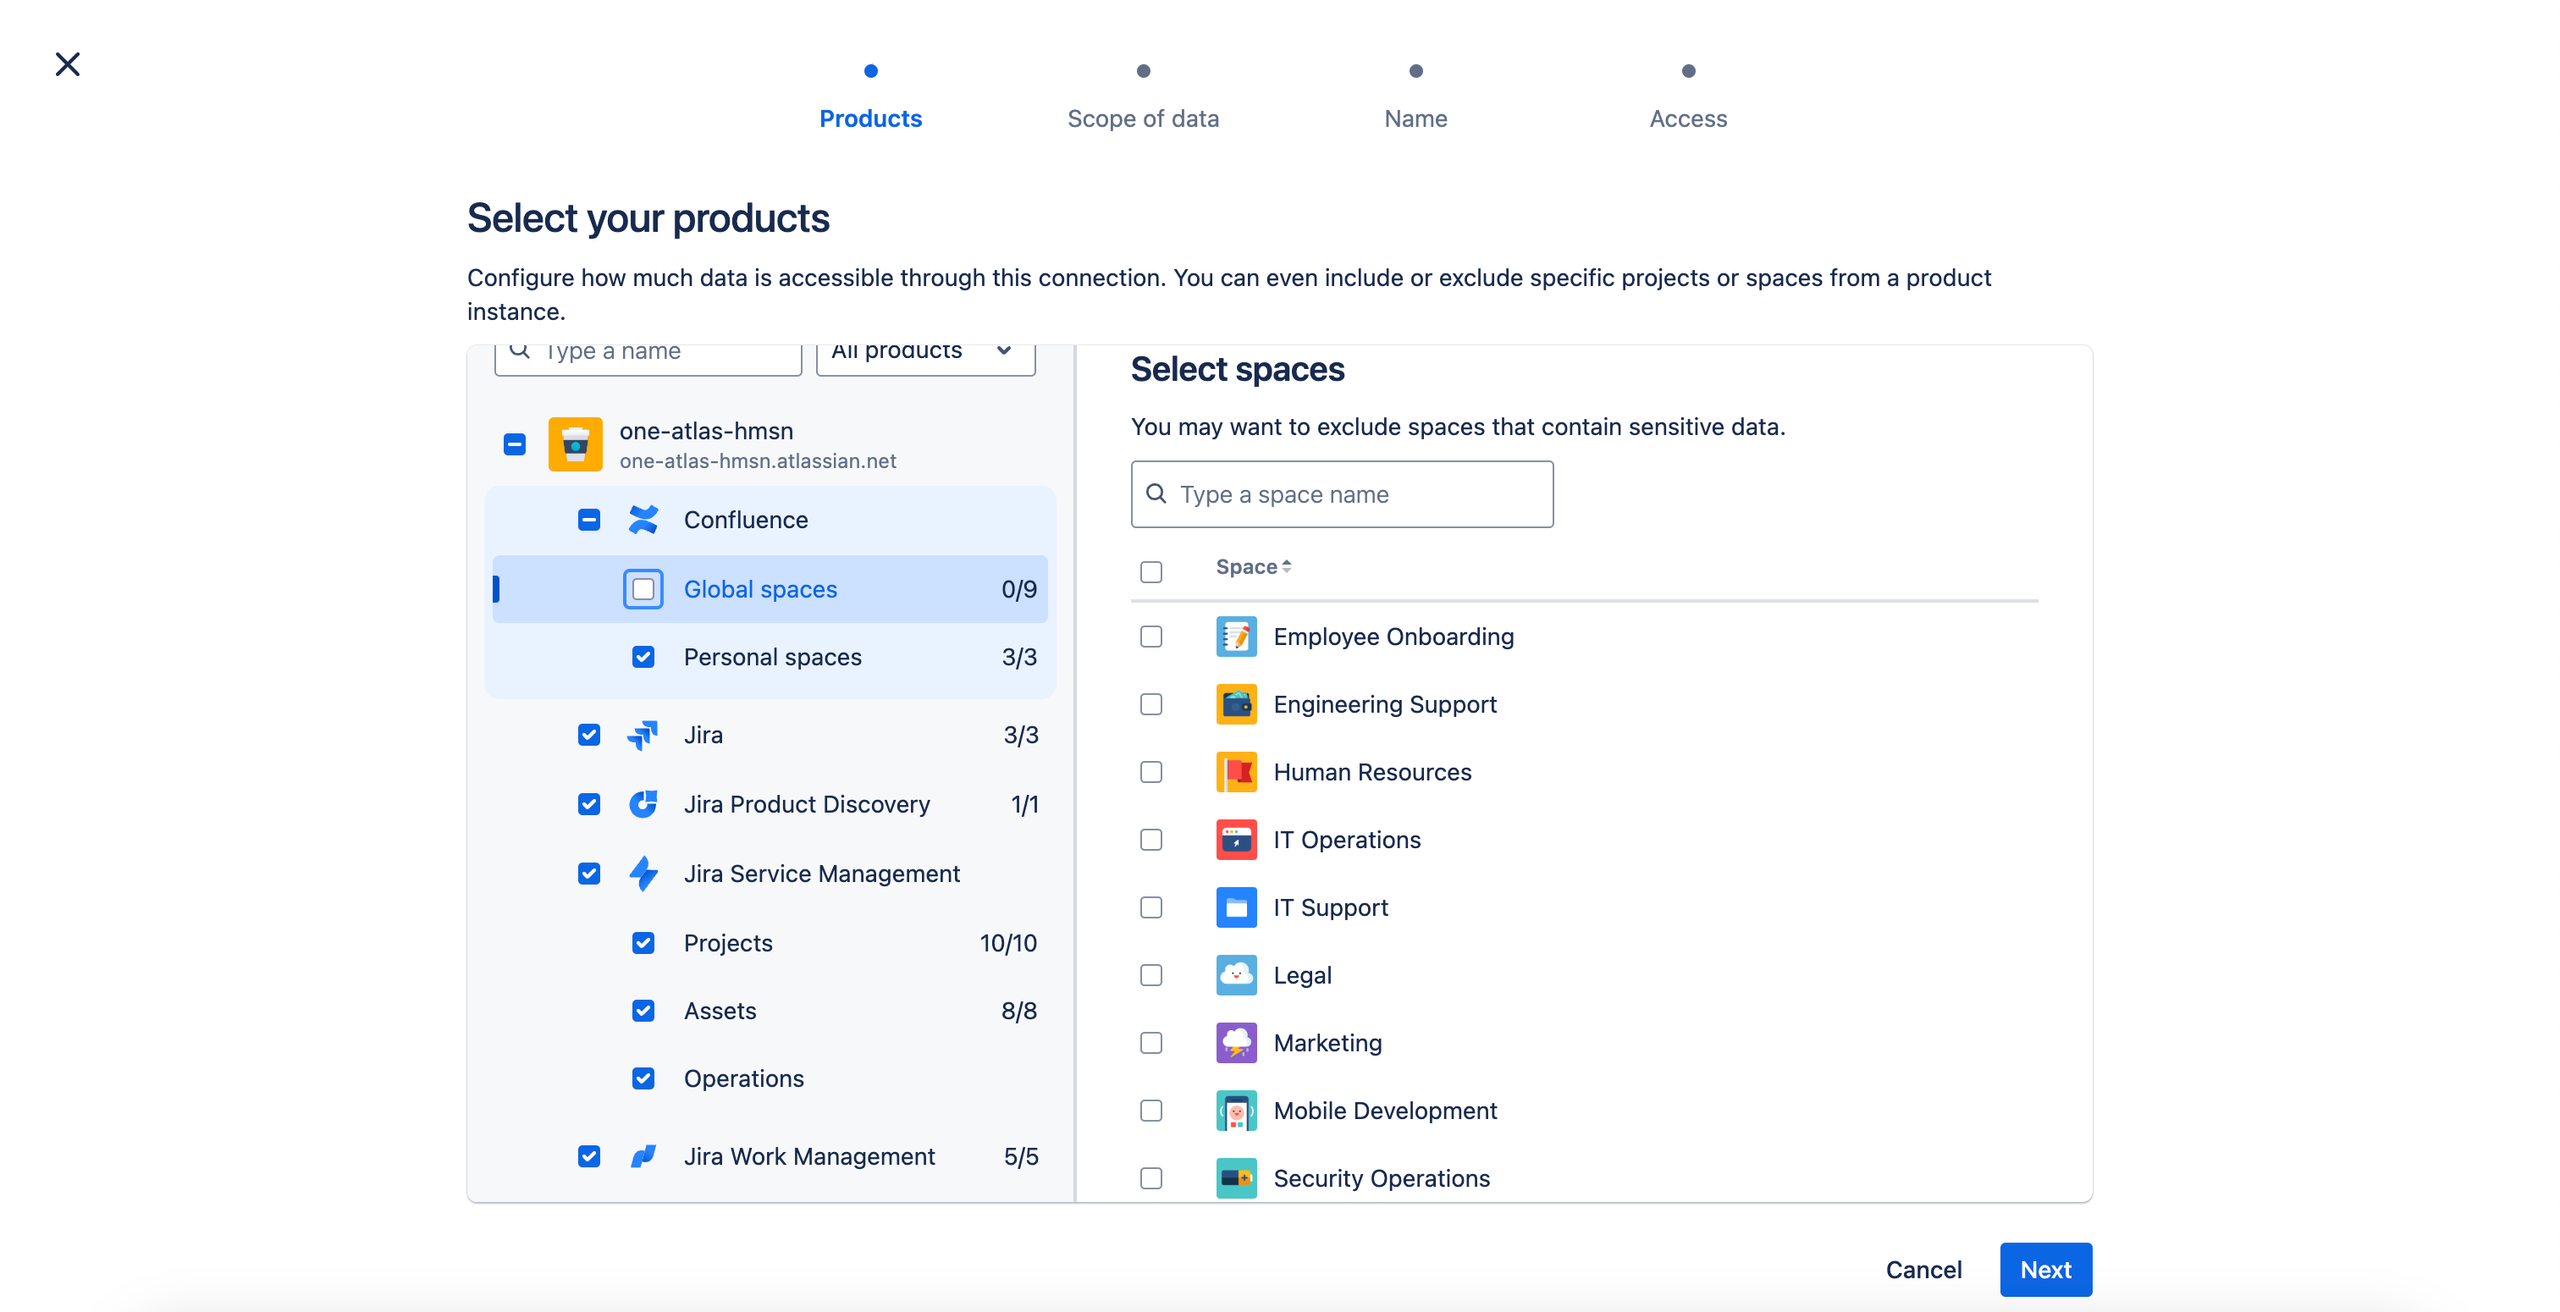
When creating the Data Lake, you can use its granular selection capabilities to focus on specific projects or spaces across your Jira and Confluence environments. This allows you to filter and include only the data most relevant to your analysis. For example, you can selectively pull data from particular Jira projects or Confluence spaces, ensuring that the data lake only contains the necessary information. This feature is handy when managing large-scale environments with multiple teams, as it lets you refine the scope of your insights and streamline reporting for specific workflows, departments, or initiatives. Doing so ensures you aren't overwhelmed by unnecessary data, focusing instead on key performance metrics across the organization.
Atlassian Data Lake scopes of data
-
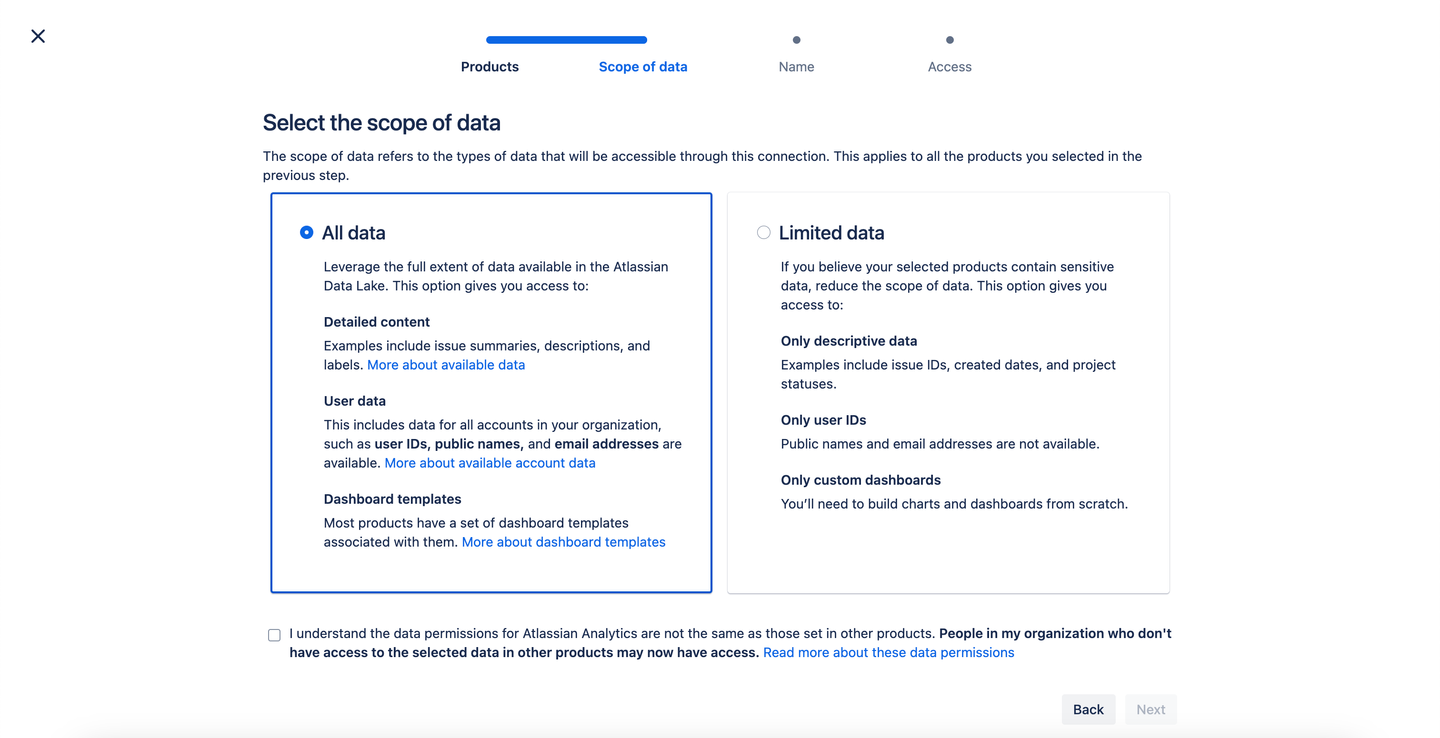
All Data: This scope provides access to detailed, human-readable information across all your Atlassian tools. It includes enriched fields, such as issue summaries, page titles, descriptions, and attachments, as well as more technical data like issue type IDs, project IDs, and timestamps. This option is ideal when you want comprehensive insights, making creating in-depth reports and dashboards easier.
-
Limited Data: This scope is a more restricted version that limits the information included, primarily to exclude sensitive or unnecessary details. It allows for high-level analysis without overloading the data lake with potentially irrelevant or confidential content. This option benefits teams focused on privacy or those needing only a basic overview for specific queries.
Data shares
Data shares in Atlassian Analytics enable organizations to export and share data from the Atlassian Data Lake to external business intelligence (BI) tools or other analytics platforms. This feature allows teams to leverage their Atlassian data in familiar tools like Tableau, Power BI, or other BI platforms, making it easier to perform deeper analysis or combine Atlassian data with other business-critical data sets such as sales, financial metrics, or customer feedback.
The data shares functionality provides a secure, permission-based system to ensure only authorized users can access and work with the exported data. By integrating Atlassian Data Lake with BI tools, organizations can extend their data capabilities, create custom reports, and visualize information beyond Atlassian's built-in analytics while maintaining data privacy and security.

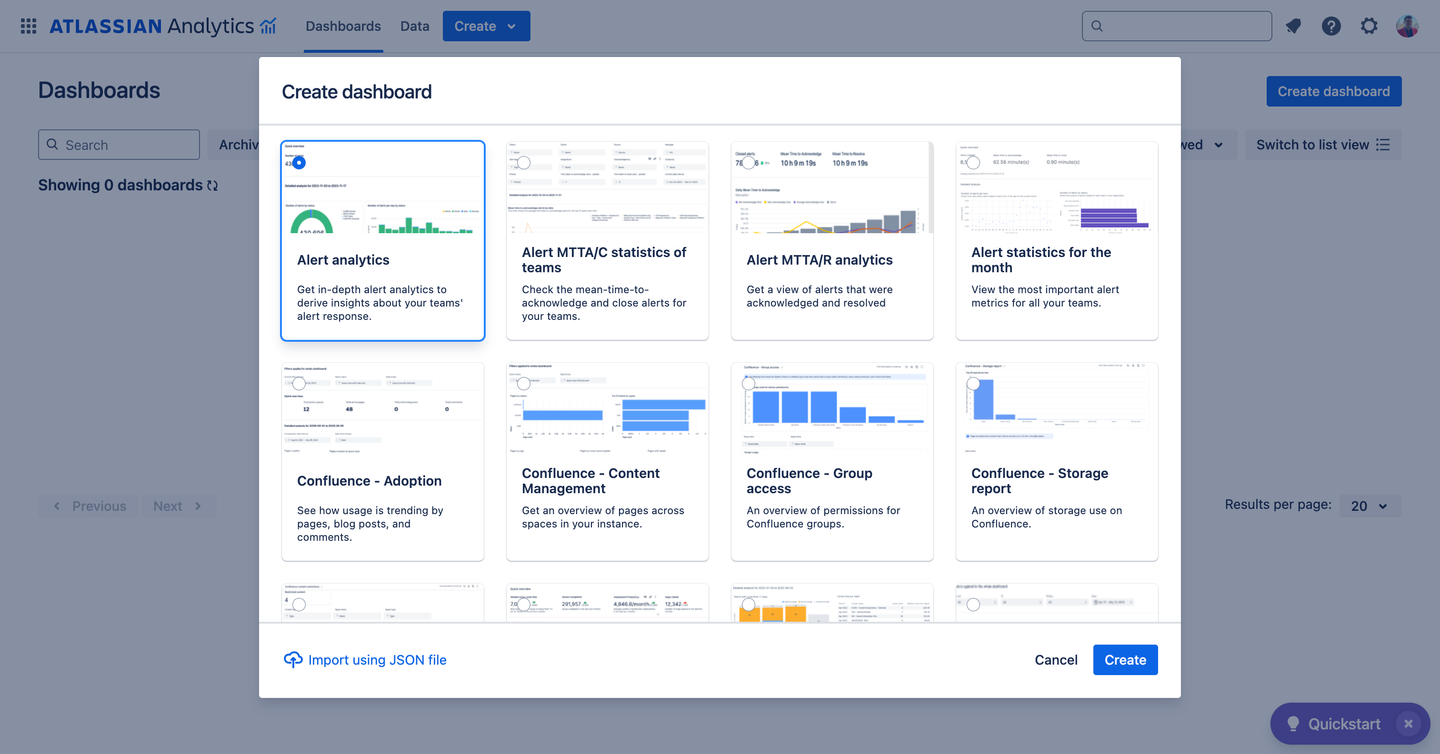
Comprehensive templates
Out-of-the-box templates help users quickly create insightful dashboards and reports without starting from scratch. These templates cover various use cases across Atlassian tools, such as Jira Software, Jira Service Management, and Confluence, providing pre-configured reports with standard metrics and visualizations.
These templates are highly customizable, allowing users to adapt them to their organizational needs. They serve as a starting point for gaining insights into key operational areas and help users quickly set up dashboards tailored to their projects or teams.
Customizable dashboards
Atlassian Analytics offers customizable dashboards that allow users to design and build personalized visual reports using a simple drag-and-drop interface. These highly flexible dashboards enable users to add charts, controls (e.g., dropdowns and text inputs), images, and other content. This customization lets users create interactive, visually appealing dashboards tailored to their reporting needs.
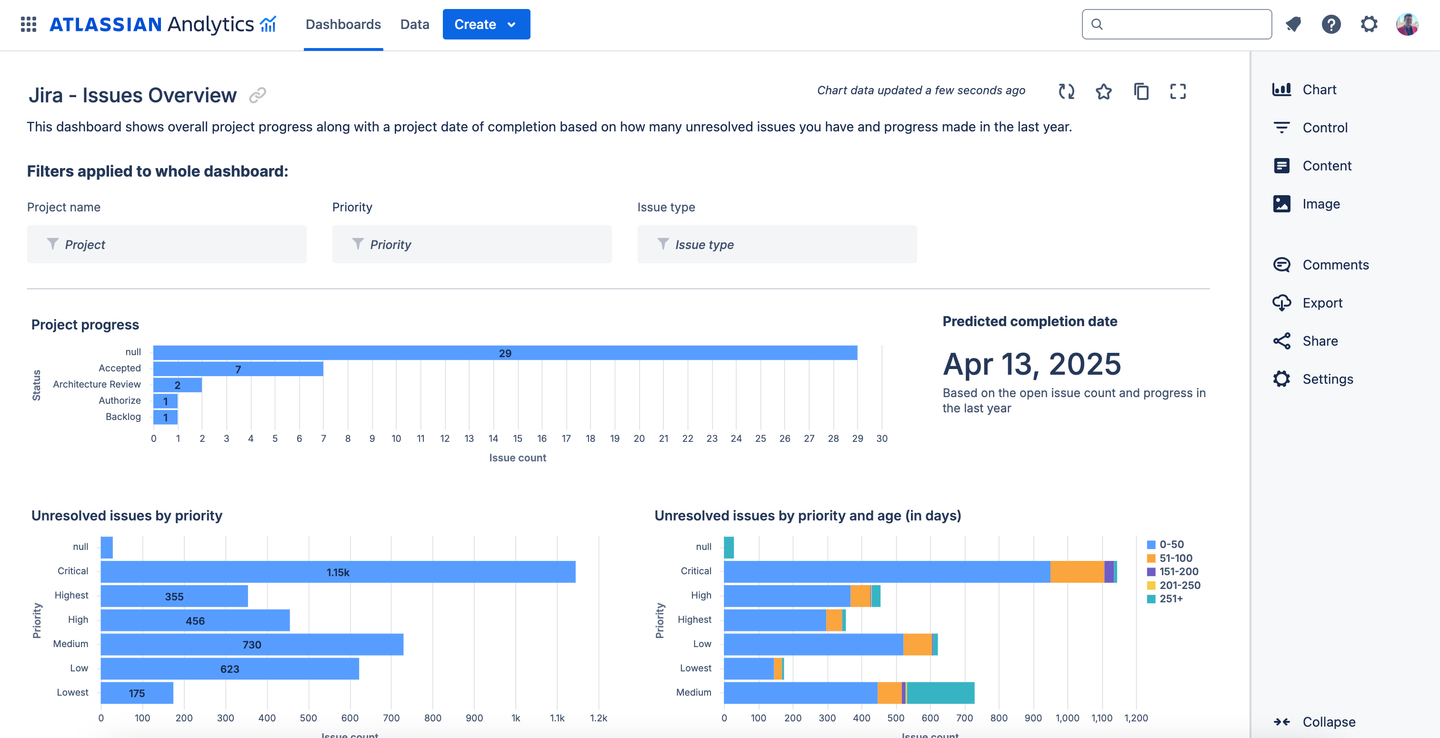
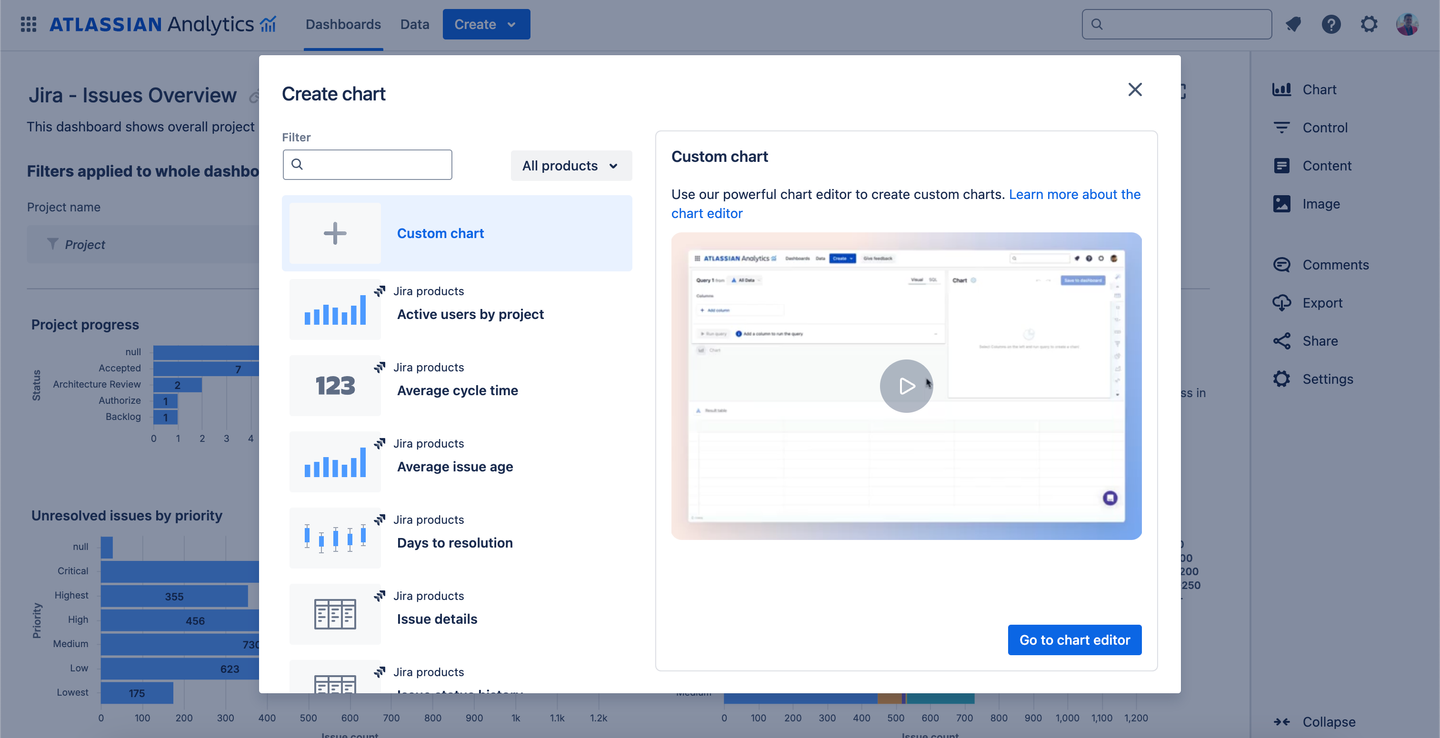
Chart templates for dashboards
Chart templates allow users to create visualizations tailored to their data efficiently. Without starting from scratch, these templates quickly generate commonly used chart types, such as bar charts, line graphs, pie charts, and tables. The chart templates are pre-designed with standard metrics, making it simple for users to drag and drop the appropriate data fields into the template and customize the visualizations to suit their specific needs.
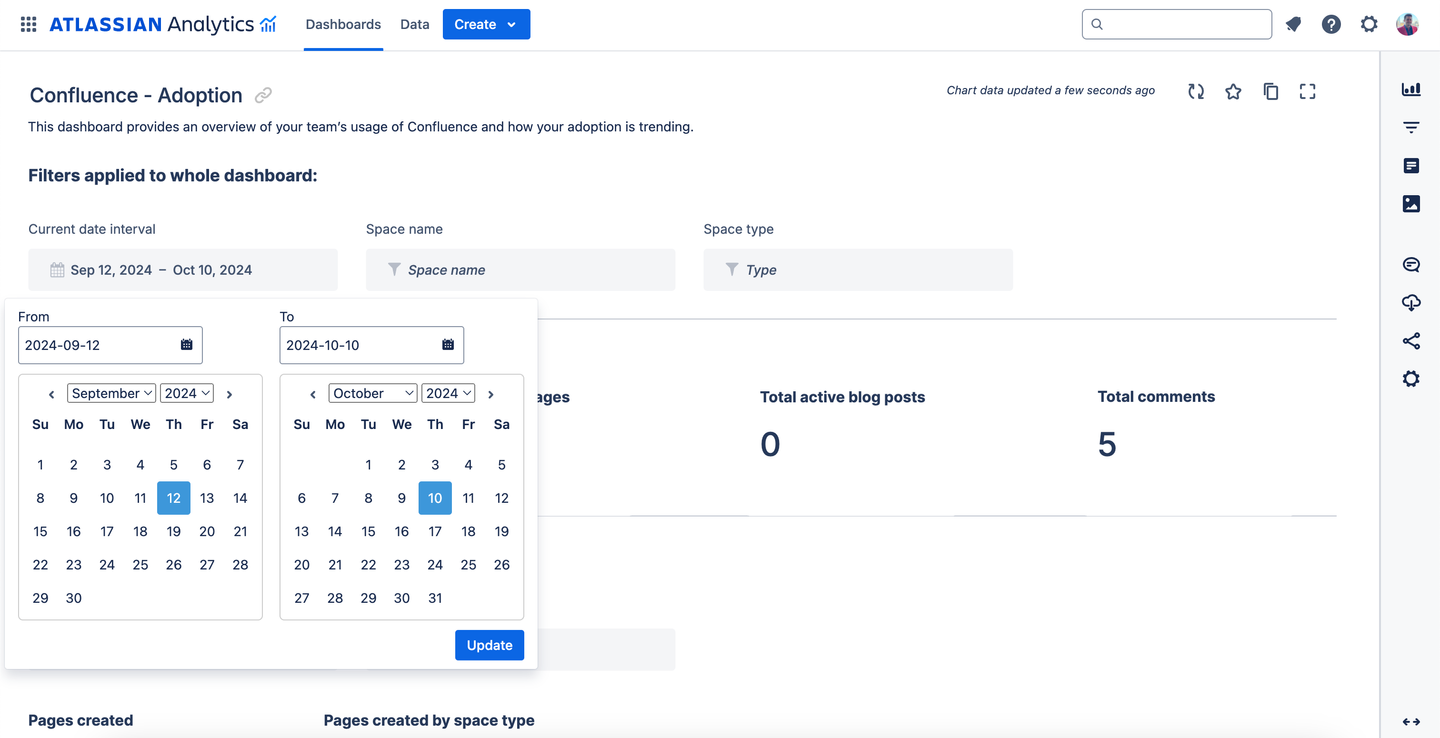
Filters for dashboards
Dashboards include customizable filters that allow users to interact with data dynamically. These filters can take the form of dropdown menus, text inputs, date pickers, or other control types, and they enable users to drill down into specific data points or refine their views without modifying the underlying charts. For example, you might filter data by project, team, date range, or status, which updates the displayed charts and tables in real time.
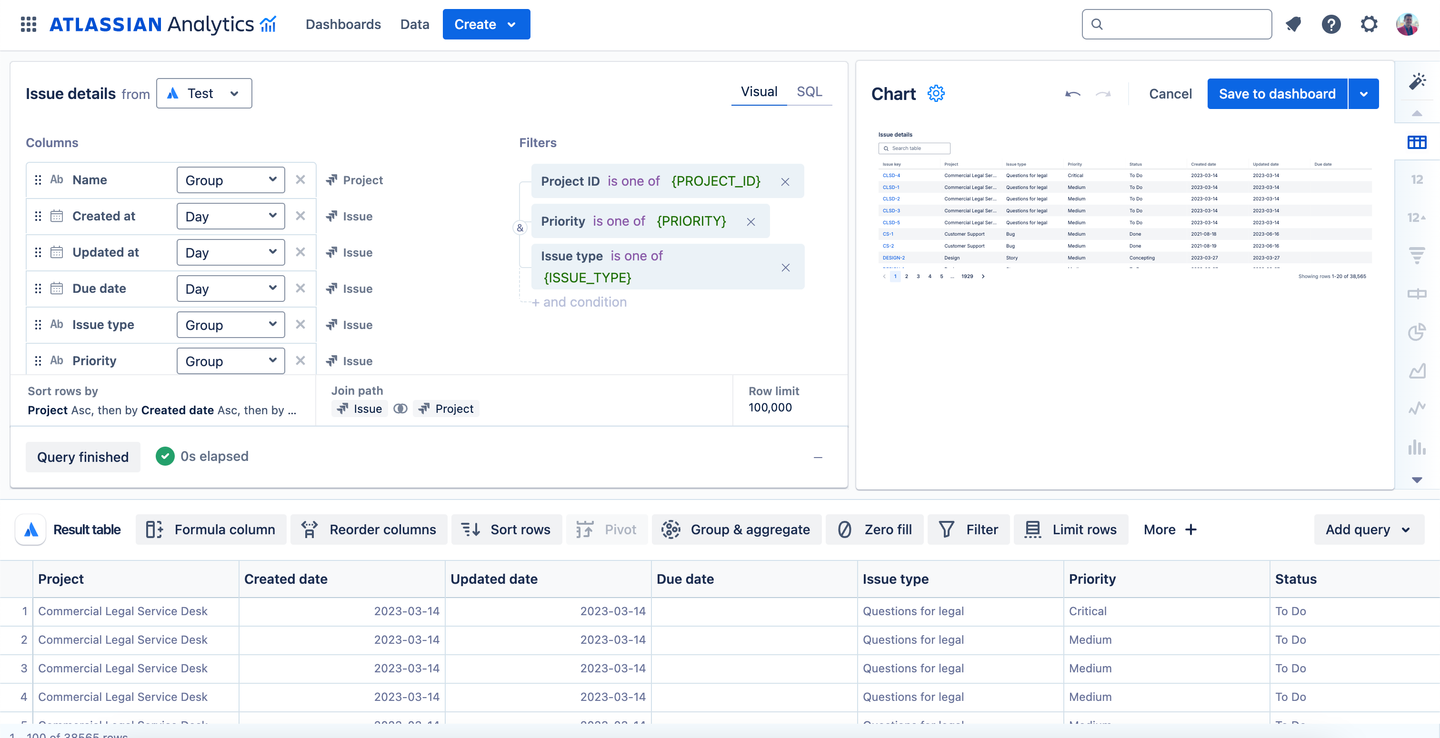
Visual SQL for charts
Atlassian provides Visual SQL, a drag-and-drop interface that simplifies query-building for users who prefer a no-code approach. Visual SQL allows users to add, remove, and organize data columns, apply filters, and group data without writing code. This option makes it easy for non-technical users to configure their charts by selecting from pre-modeled data fields, adjusting sorting, or setting up aggregations, making it accessible to a broader range of users.
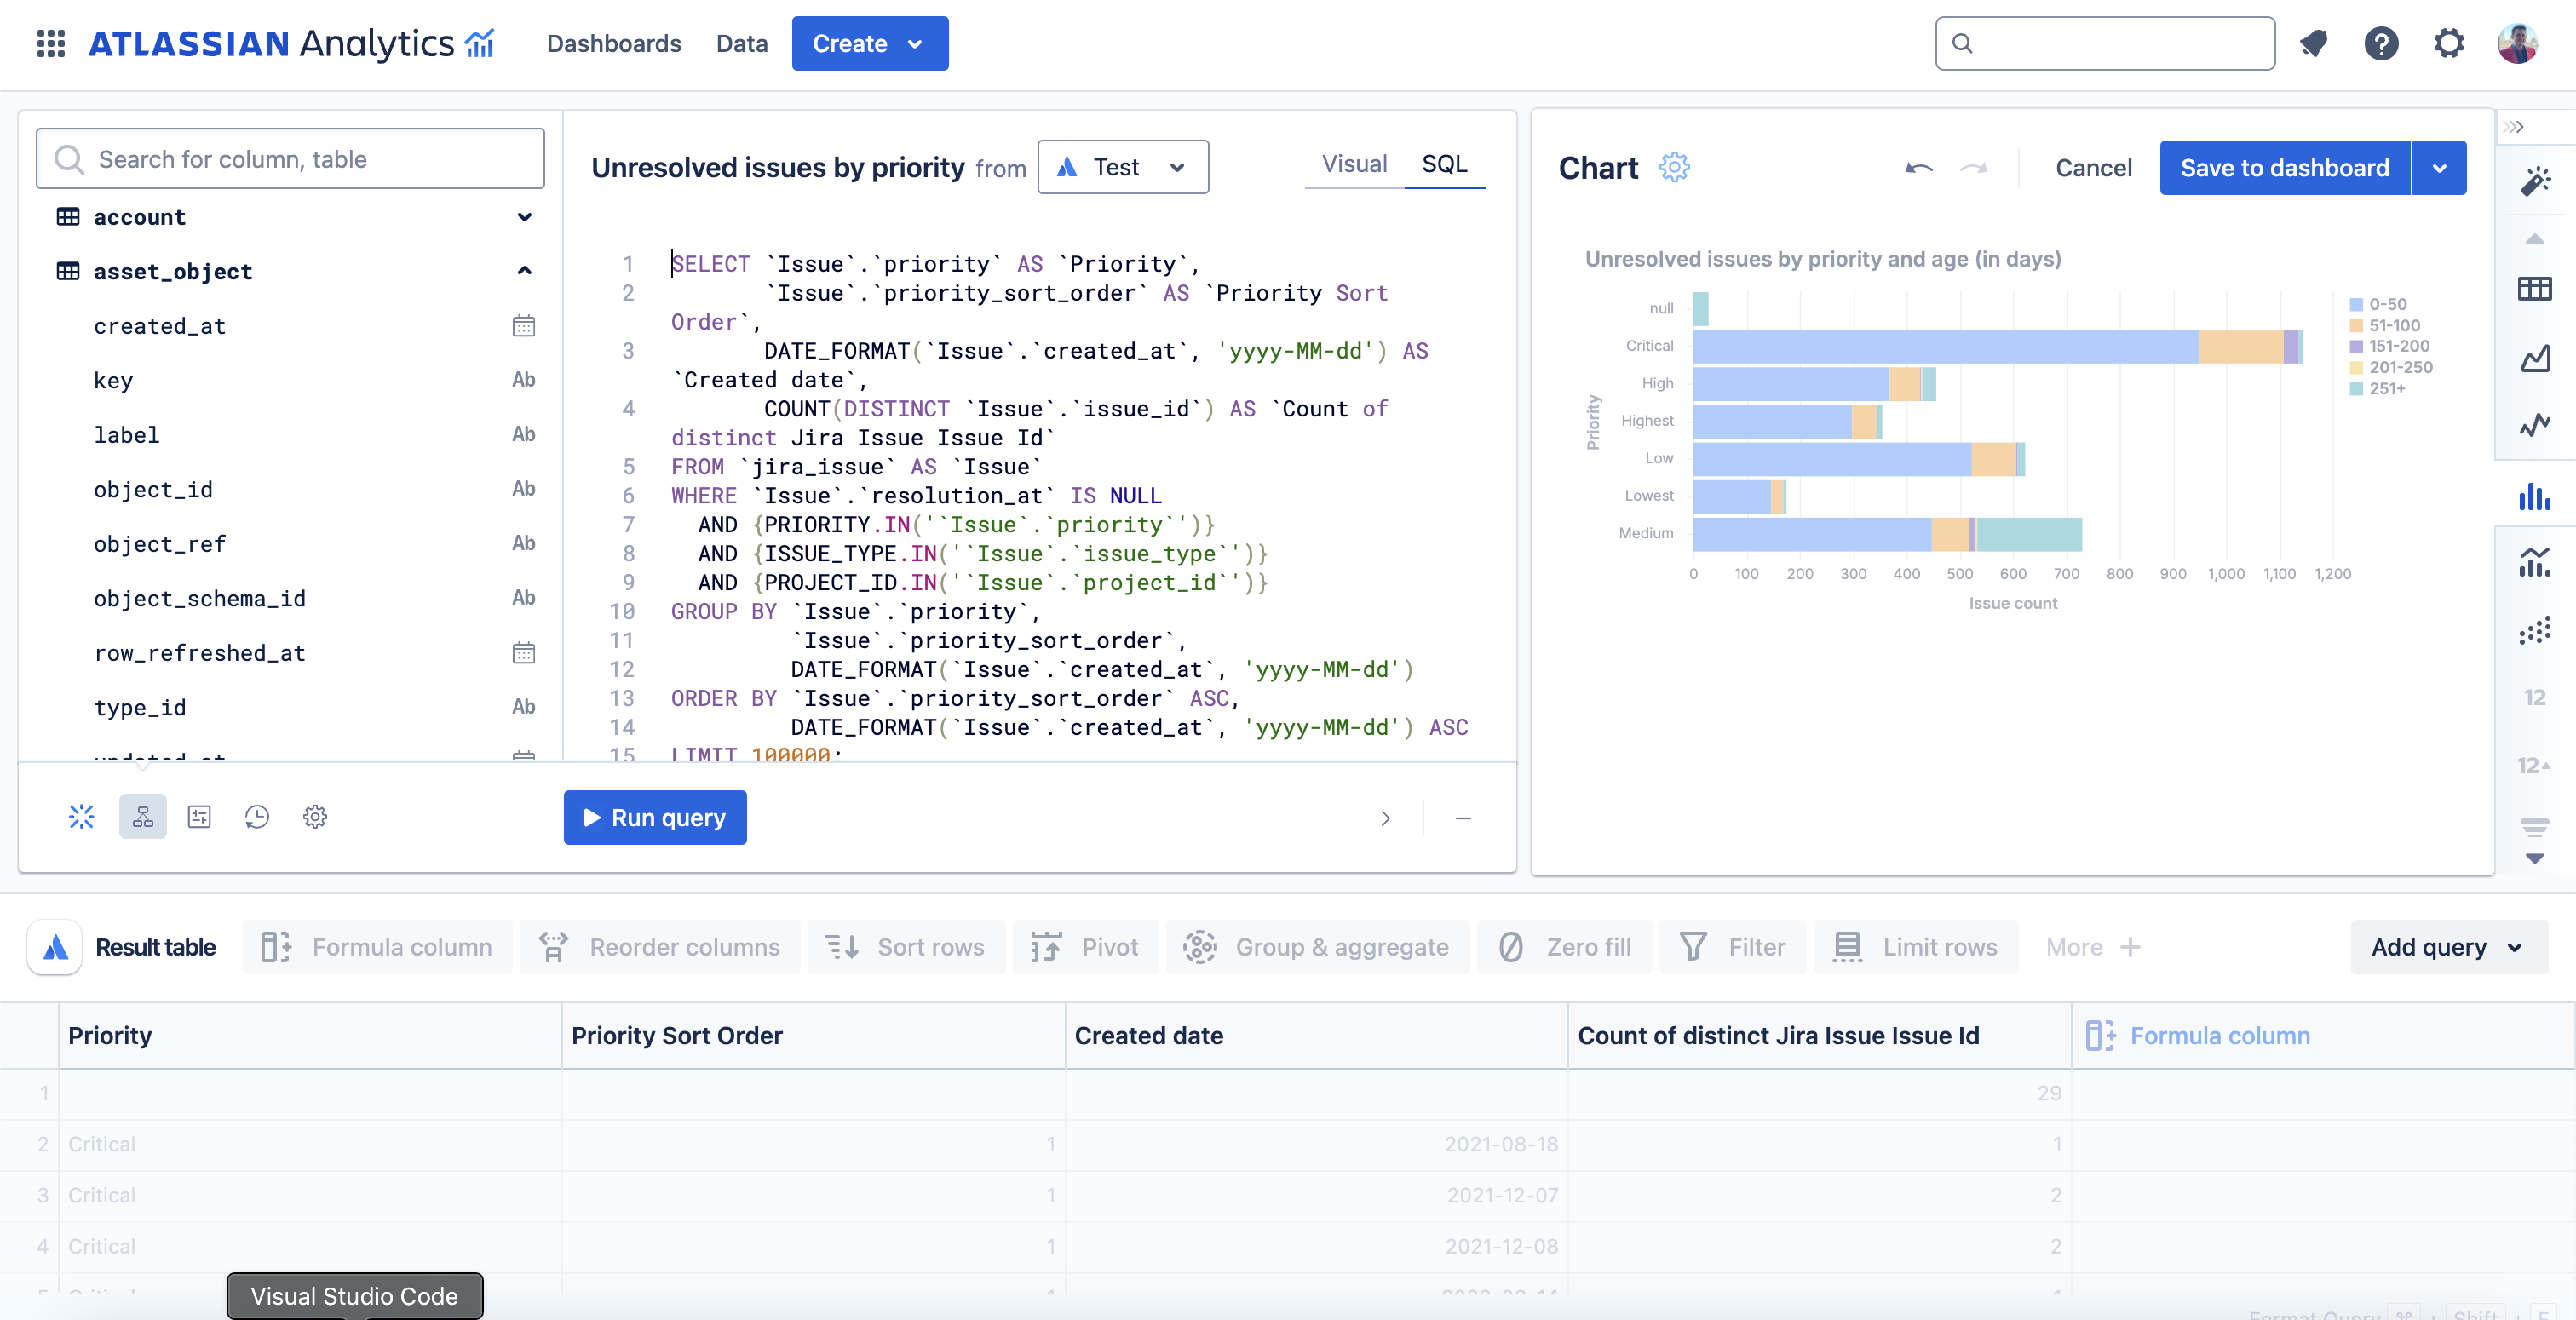
SQL for charts
In Atlassian Analytics, charts can be configured and customized using SQL to suit specific reporting needs. The SQL mode allows advanced users to write custom queries directly against the data sources, giving complete control over how the data is manipulated and visualized. This flexibility is ideal for users familiar with SQL who want to create complex queries that pull in concrete data sets or apply unique logic to the data.
Atlassian Inteligence
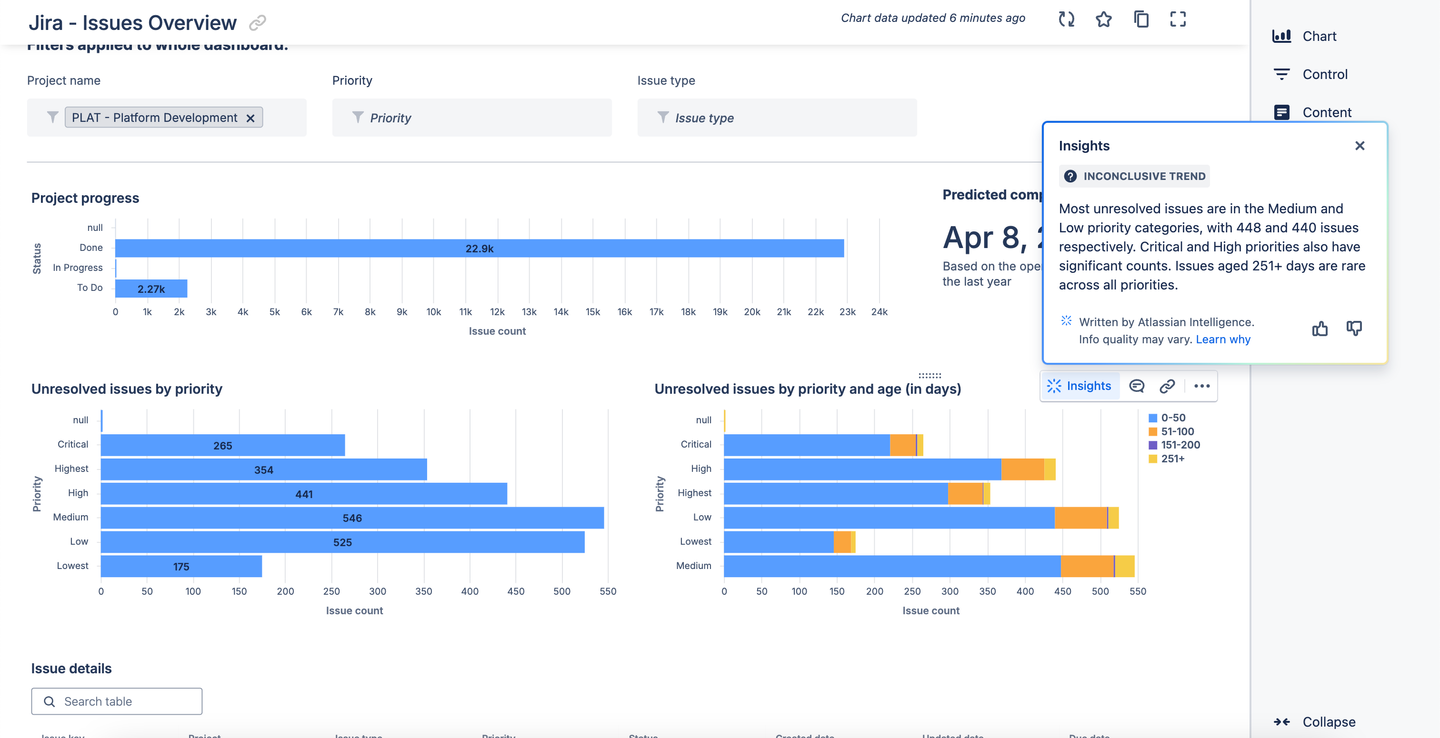
Insights for charts
Atlassian Analytics integrates Atlassian Intelligence to help users derive deeper insights from their charts and dashboards with minimal effort. This AI-powered feature can automatically analyze the data in your charts and provide meaningful insights, such as identifying trends, anomalies, or outliers that might otherwise be overlooked.
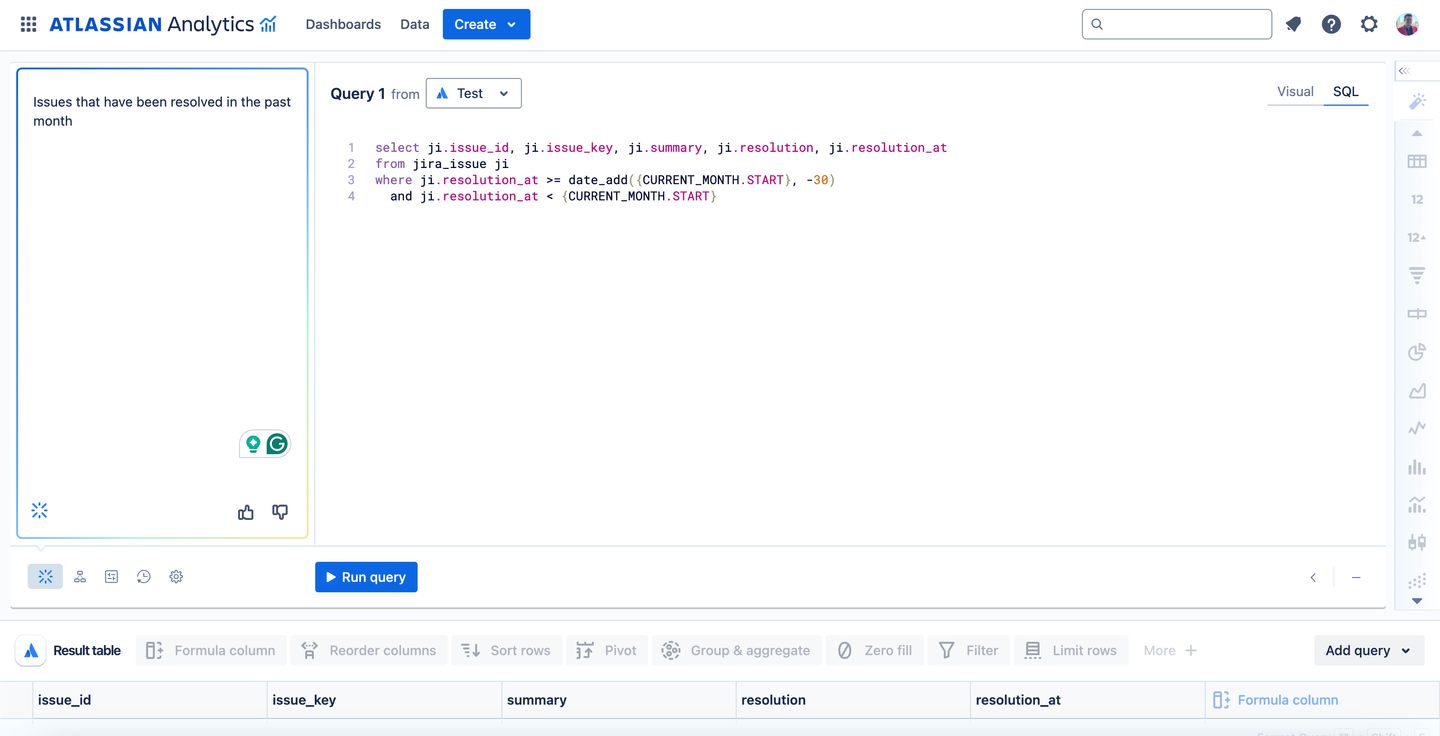
SQL generation for charts
Atlassian Intelligence can assist in generating SQL queries for those using the SQL mode of Atlassian Analytics. It can provide recommendations on which metrics to focus on and suggest formulas or calculations based on the context of the data being analyzed. This makes chart creation and analysis more efficient, as users can leverage AI to enhance their understanding of complex data sets.
Permissions
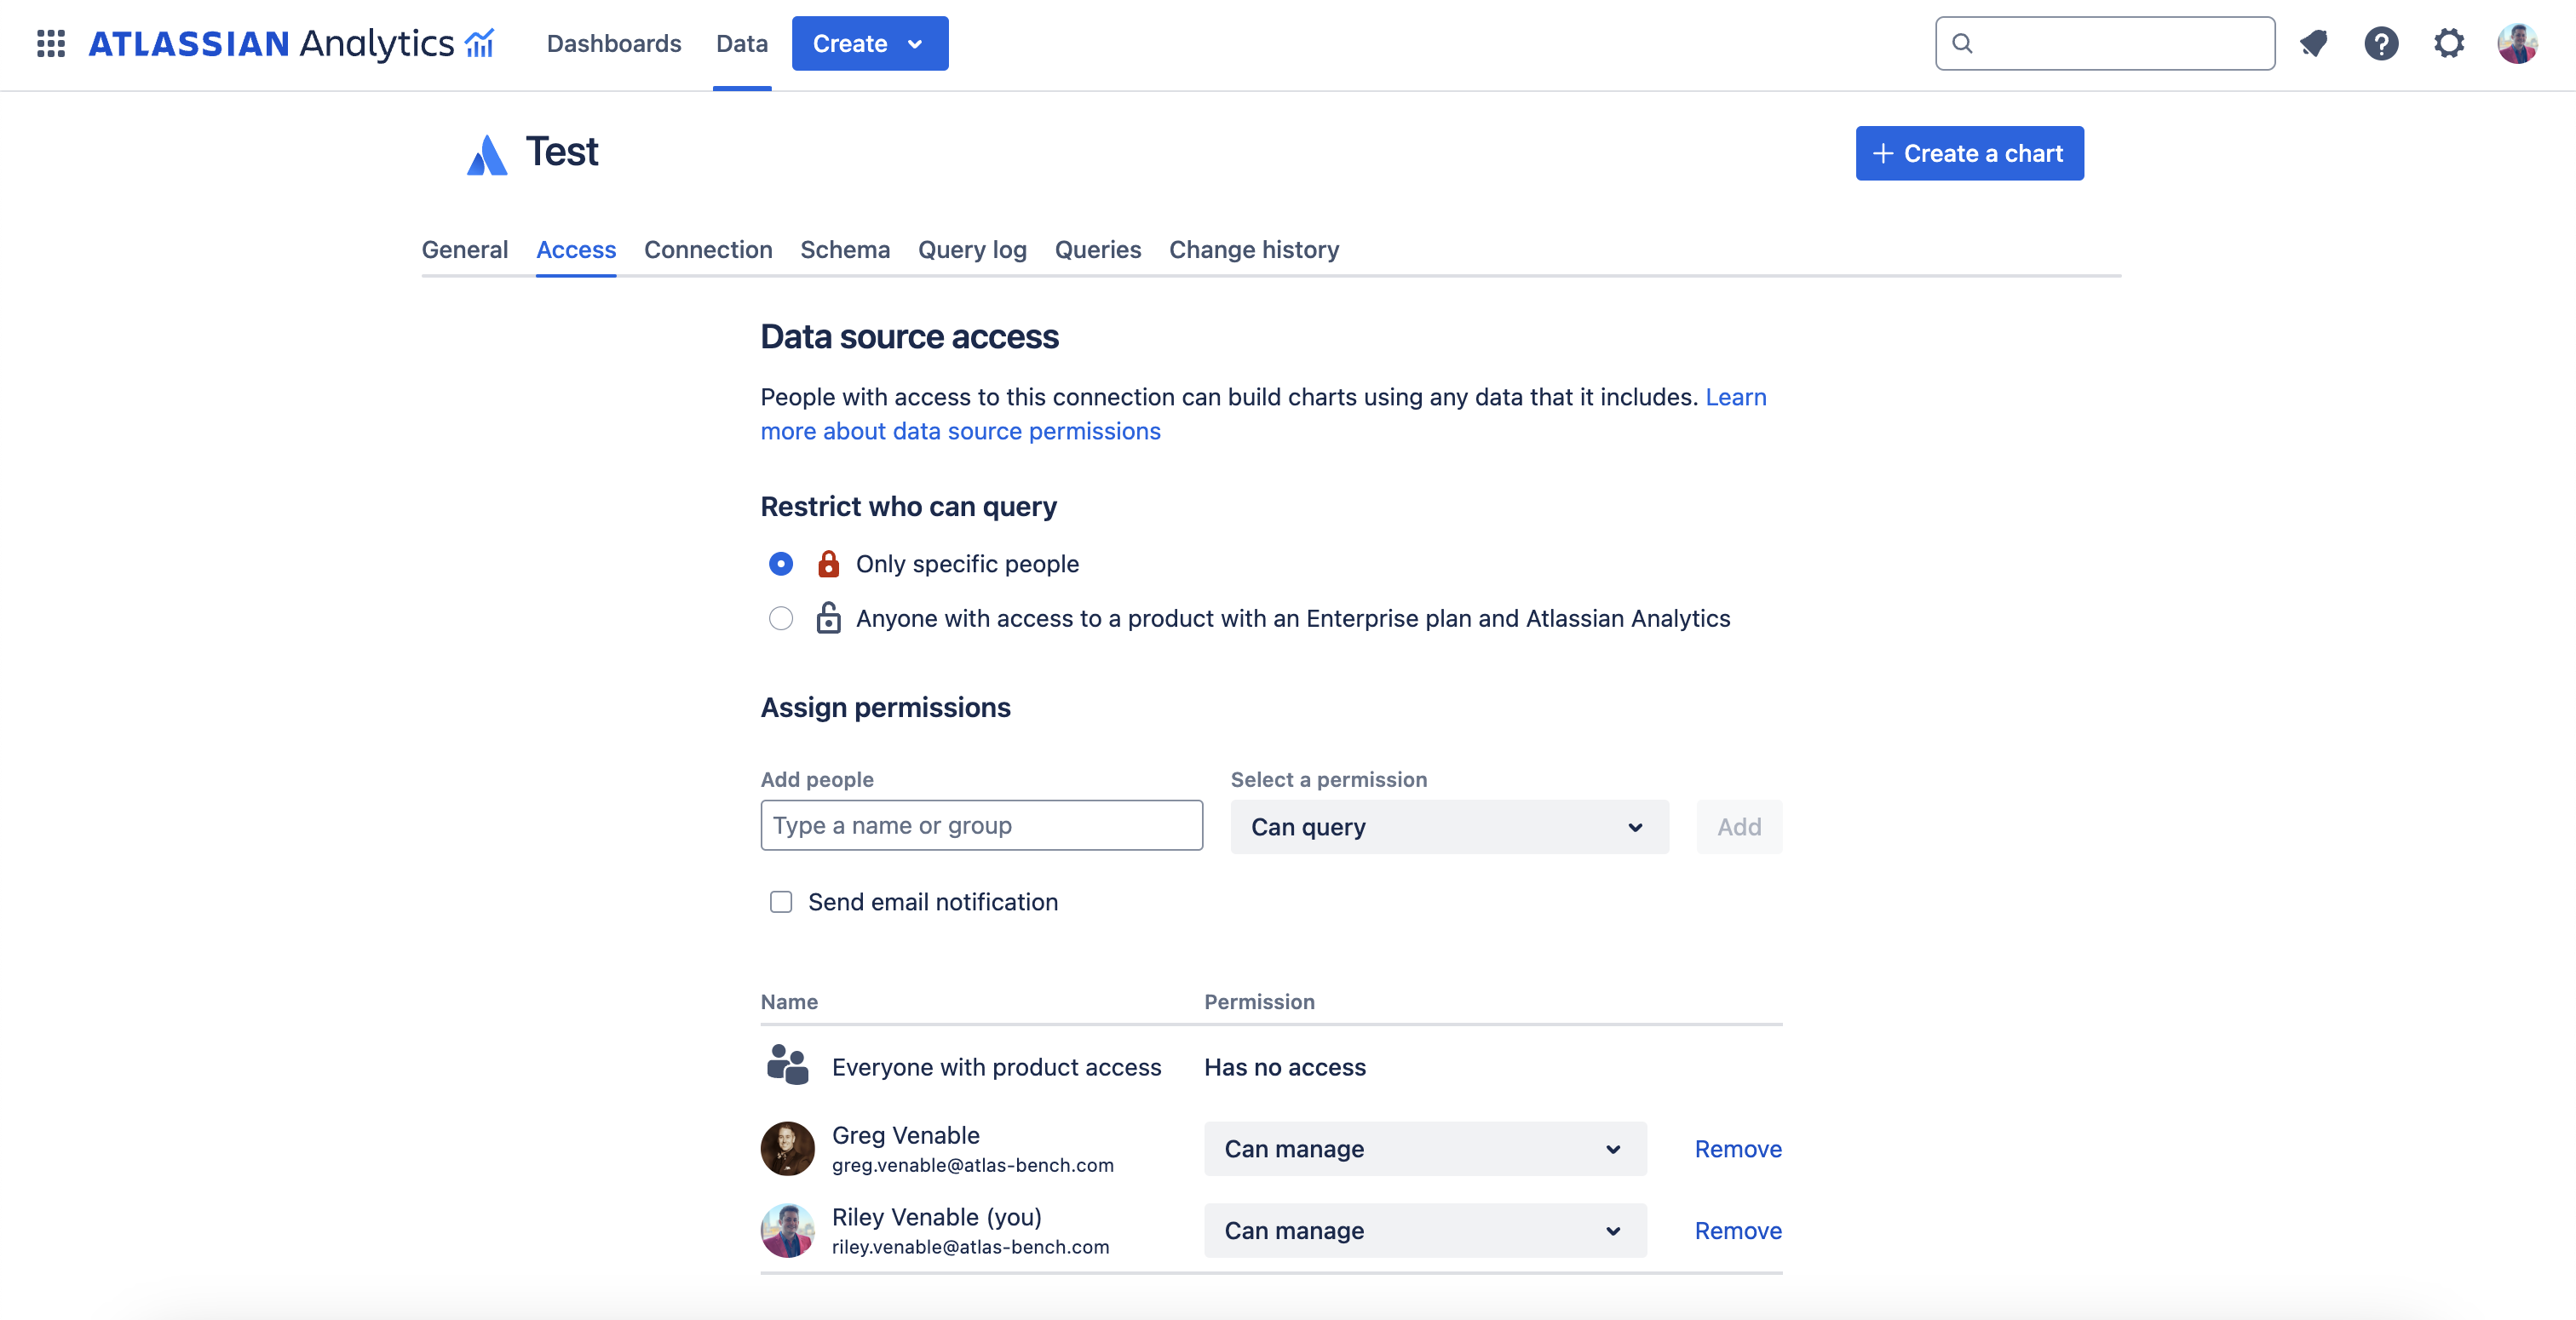
Data Source permissions
Atlassian Analytics provides robust access settings for controlling who can interact with platform data sources. These settings allow administrators to manage which users or teams have permission to access, query, or modify data from connected sources, such as the Atlassian Data Lake or third-party integrations.
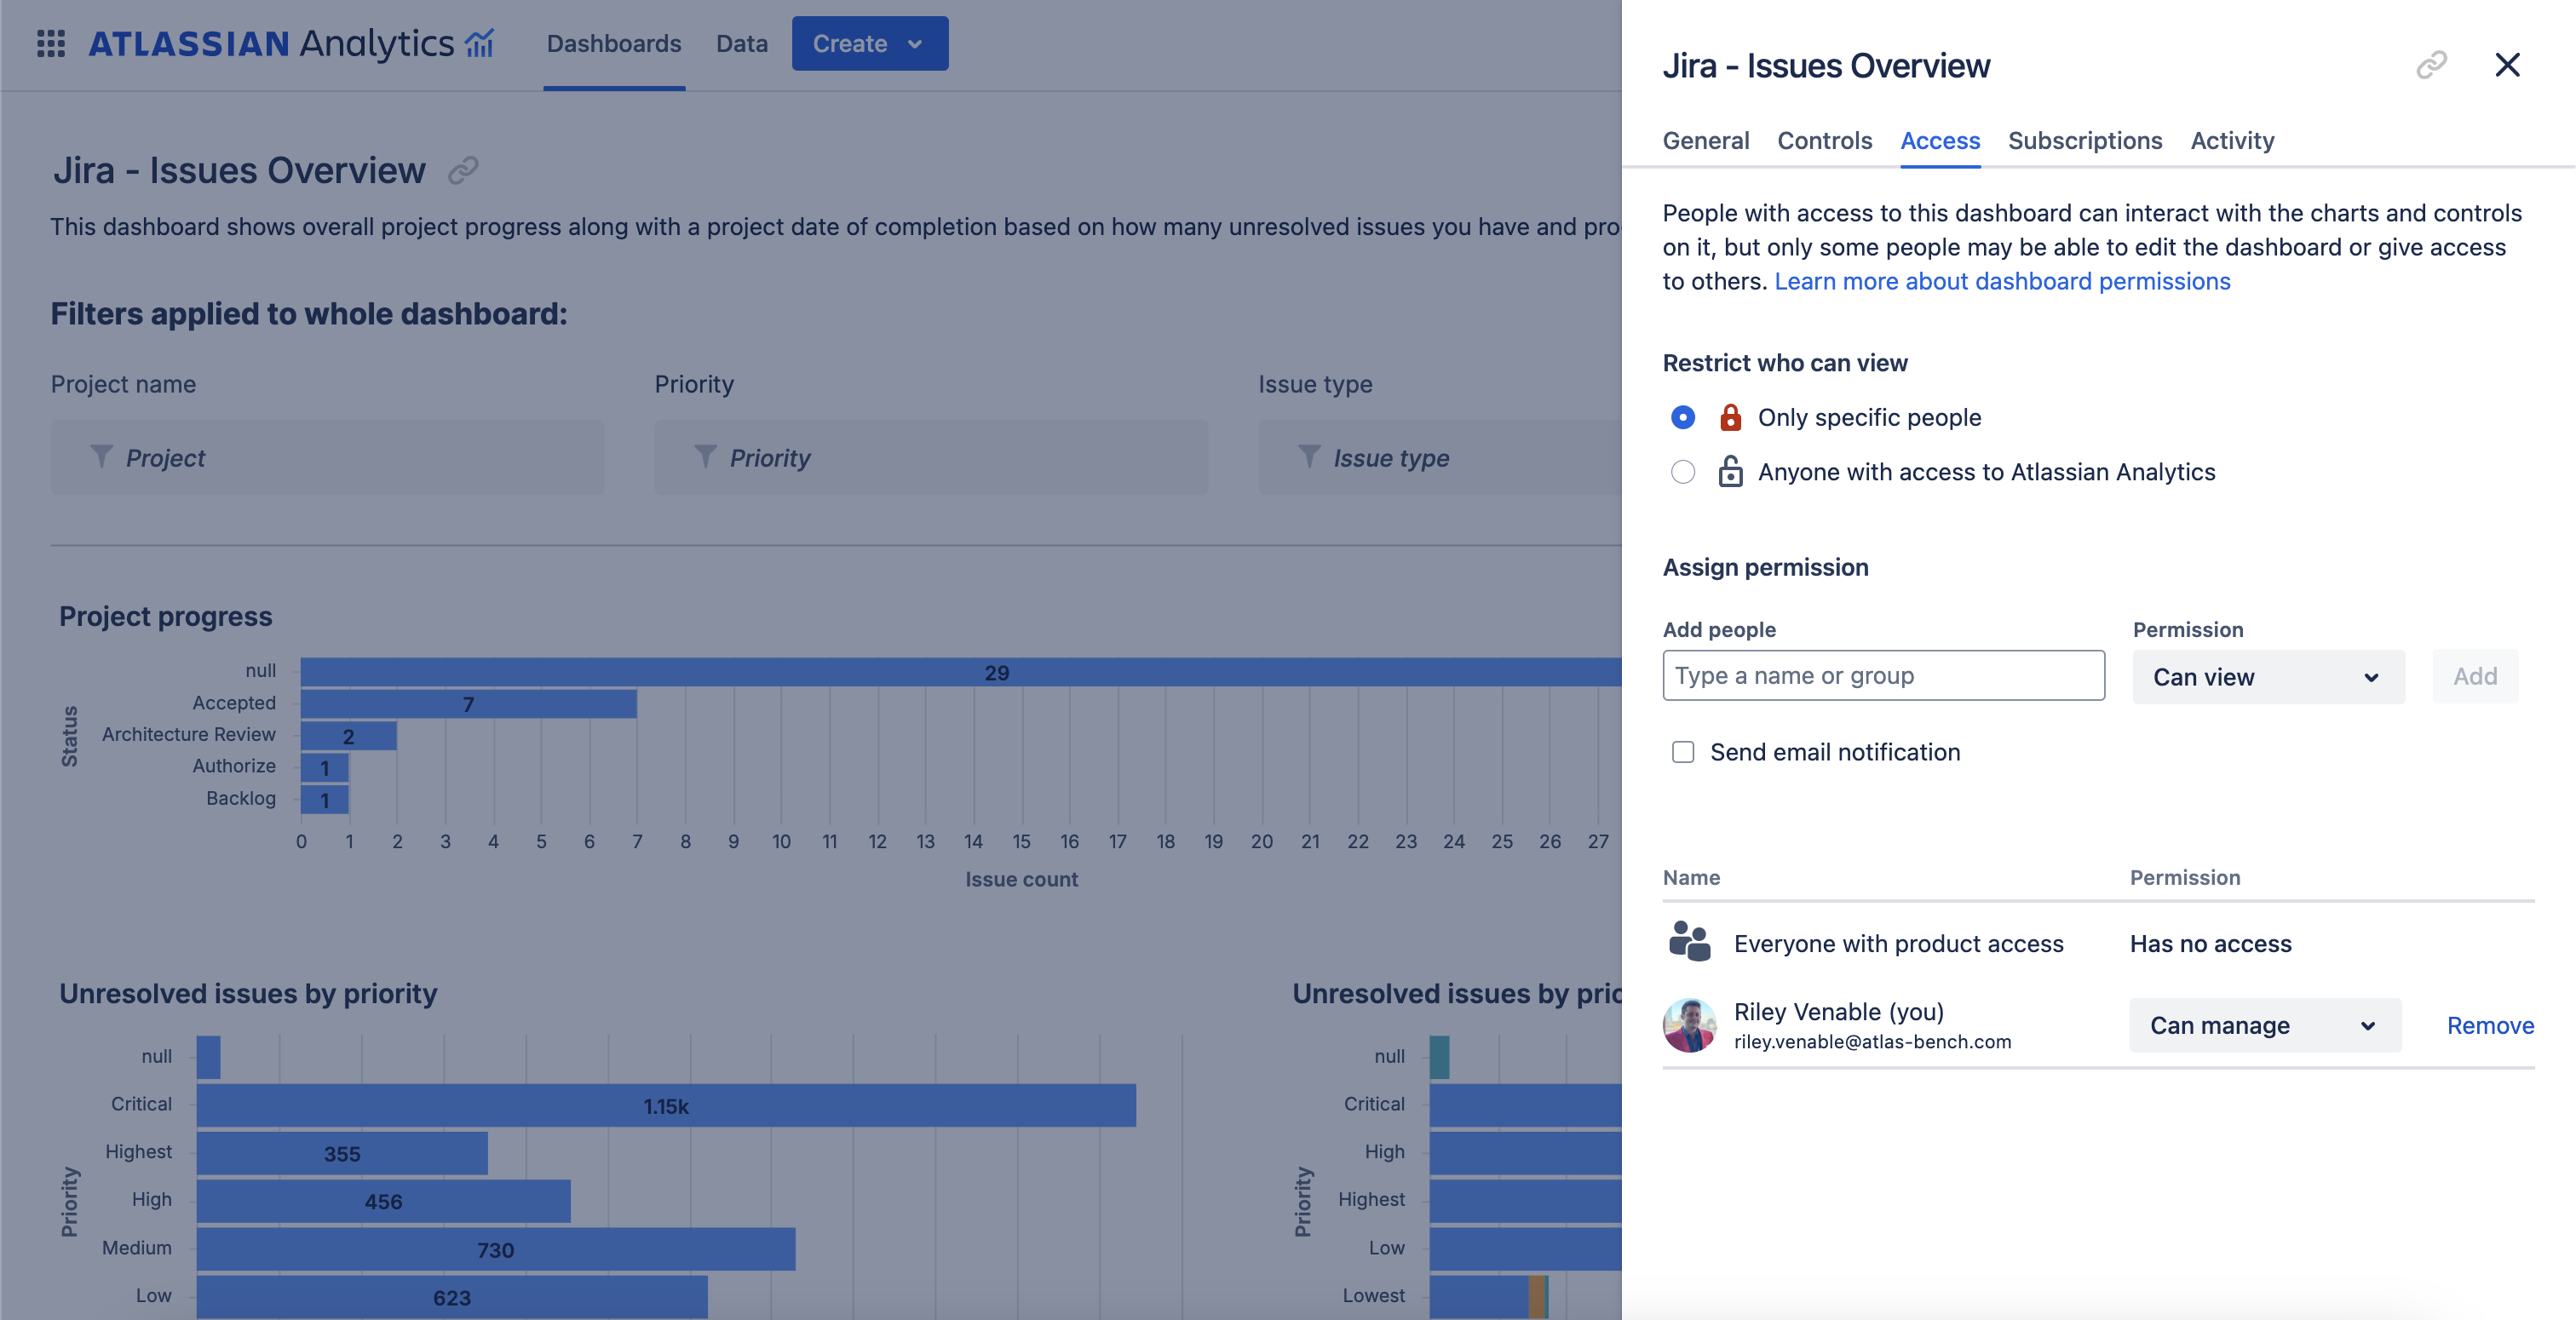
Dashboard permissions
Dashboard access settings enable administrators to control who can view, edit, and interact with dashboards. These settings allow for flexible collaboration by enabling teams to share dashboards with specific users, groups, or the entire organization. Admins can define roles such as viewers, who can only see and interact with the dashboard, and editors, who can modify the dashboard's content, such as adding or changing charts and filters.
Automated reports
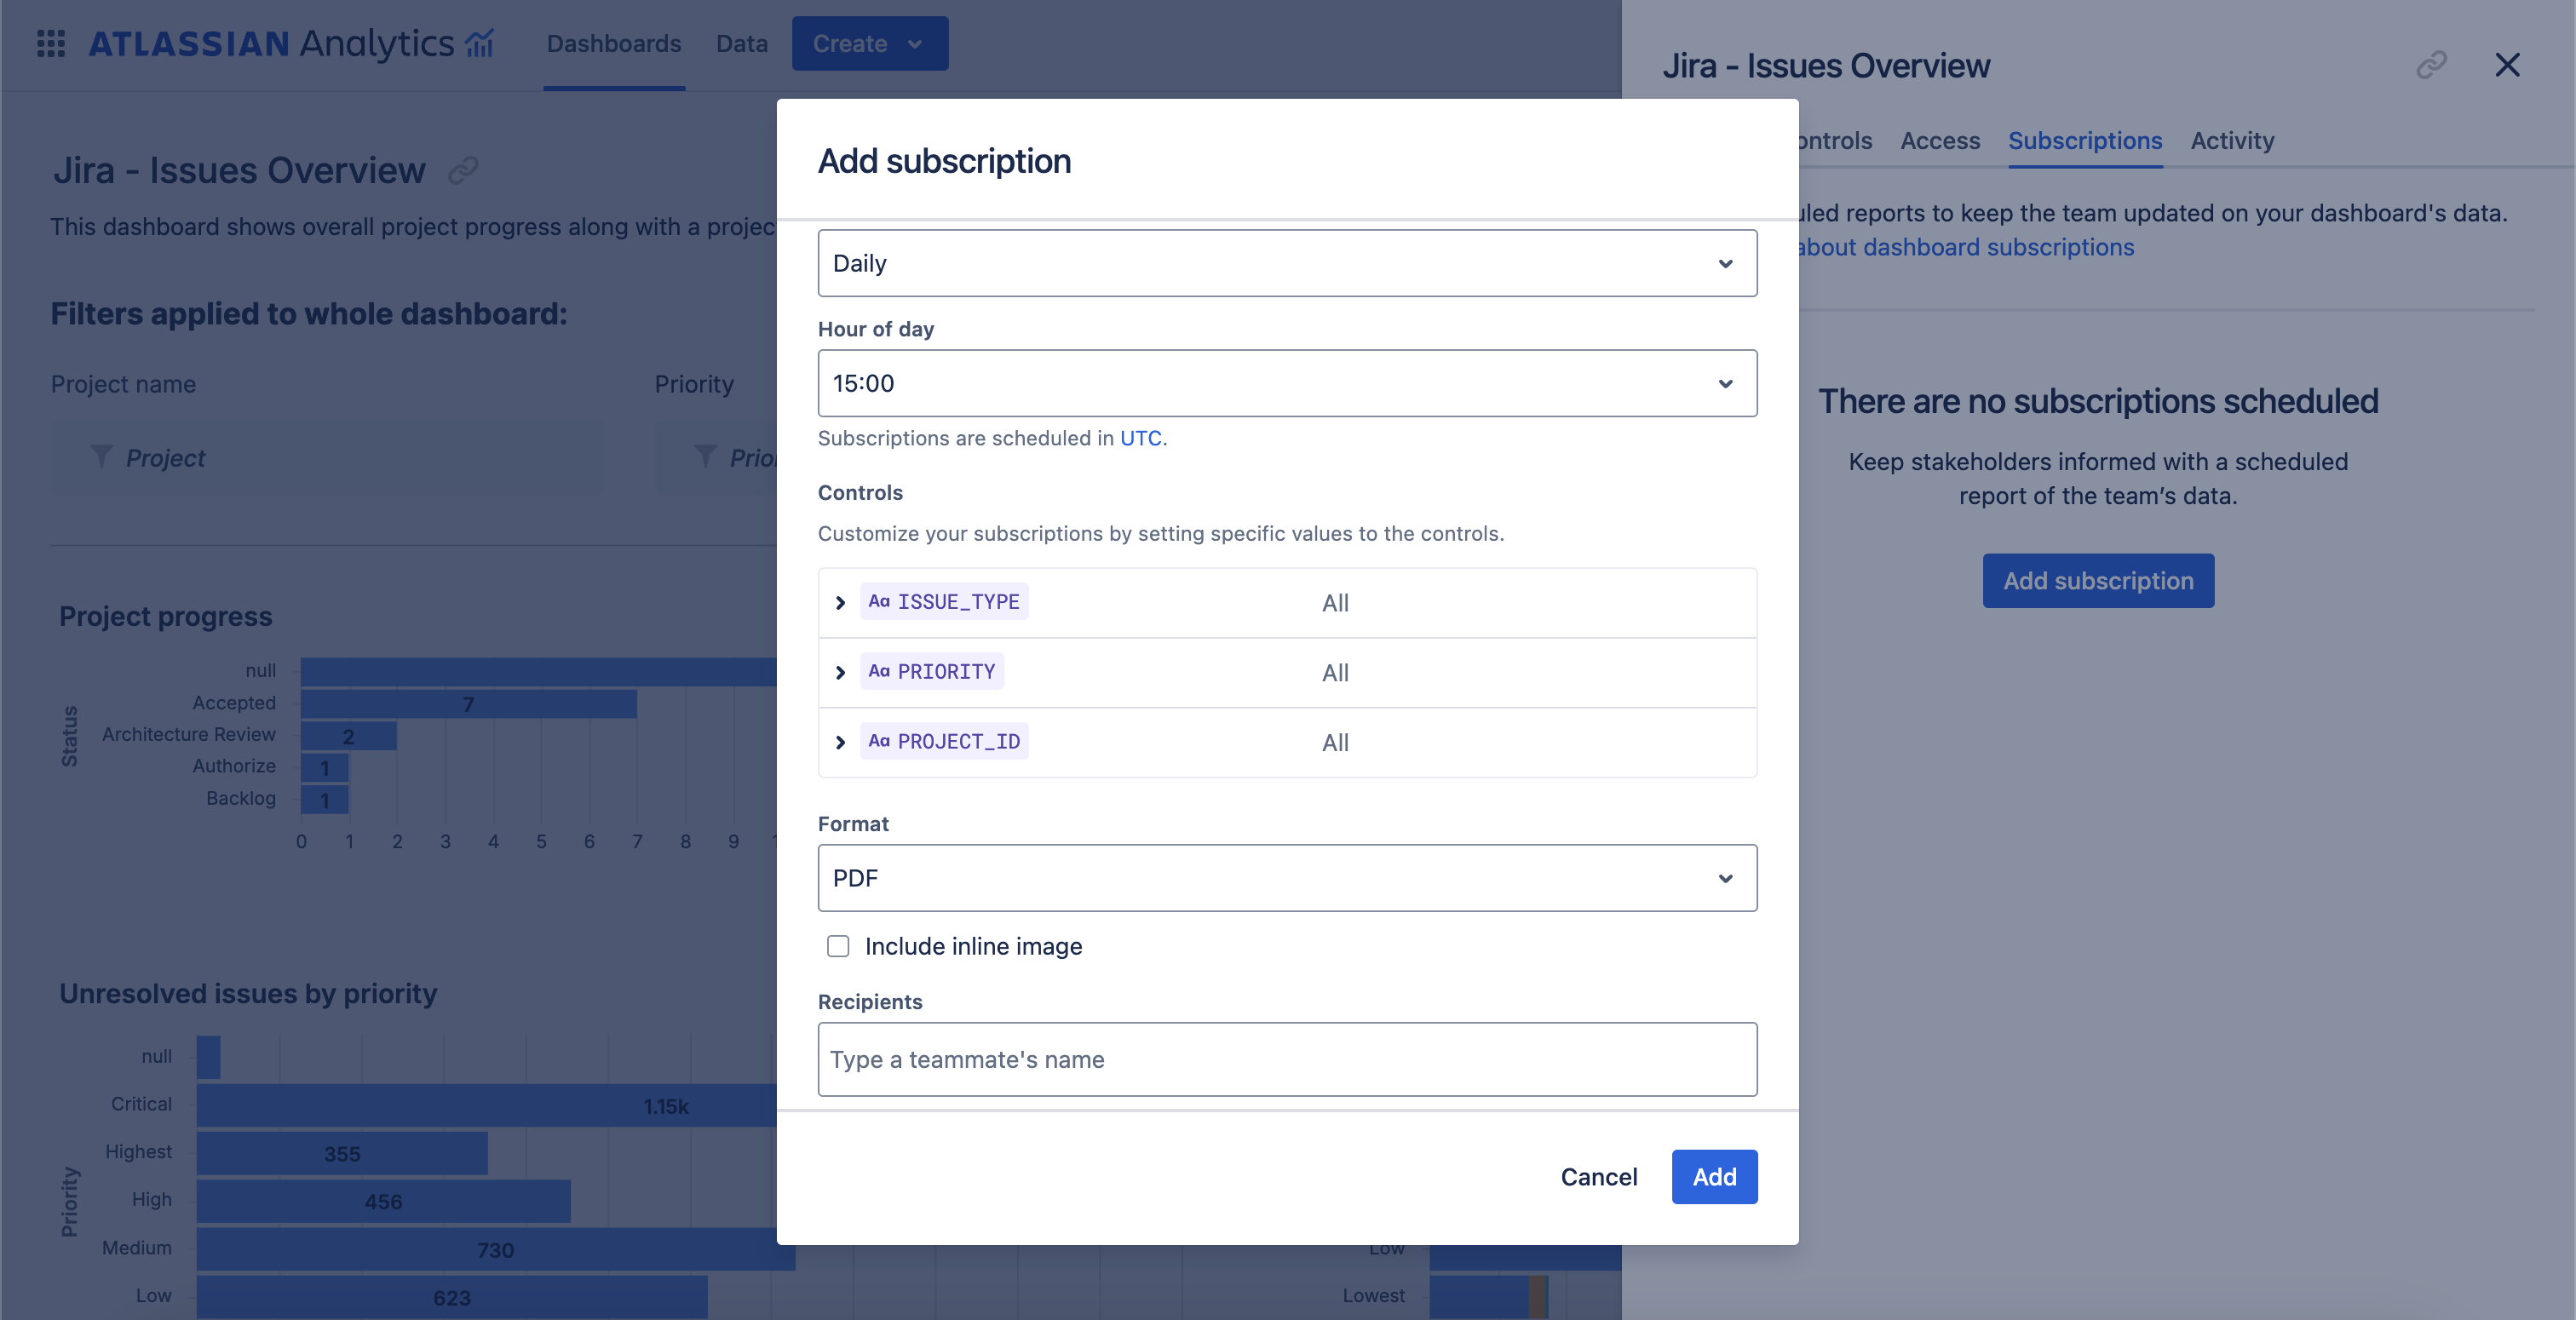
Atlassian Analytics supports automated reports for dashboards, enabling users to schedule regular report generation and delivery. This feature ensures that key stakeholders receive timely updates on critical metrics without manually pulling data. Reports can be configured to run at set intervals (e.g., daily, weekly, or monthly) and sent via email, ensuring that teams always have the latest insights. Automated reports can also be customized to focus on specific data points or sections of the dashboard, allowing for more targeted reporting based on the audience's needs.
Dashboard controls such as dropdowns, text inputs, and date pickers allow users to dynamically interact with and filter the data displayed on automated reports. These controls let users refine the scope of their analysis by selecting specific projects, time ranges, or other criteria without needing to modify the underlying dashboard configuration. This makes the automated reports more interactive and flexible, ensuring users can tailor the data view to their current needs in real-time
Users can also customize the recipients of these automated reports, ensuring that the right people receive the necessary updates. This functionality helps maintain transparency and ensures consistent reporting on essential metrics, making it easier for teams to track progress, monitor performance, and make data-driven decisions without manually interacting with the dashboards regularly.
Looking to harness the full potential of your Atlassian data? Start your Atlassian Analytics evaluation here and contact Atlas Bench, an Atlassian Partner, for a free consultation to ensure your evaluation covers all the insights that matter most to your team.